Projects


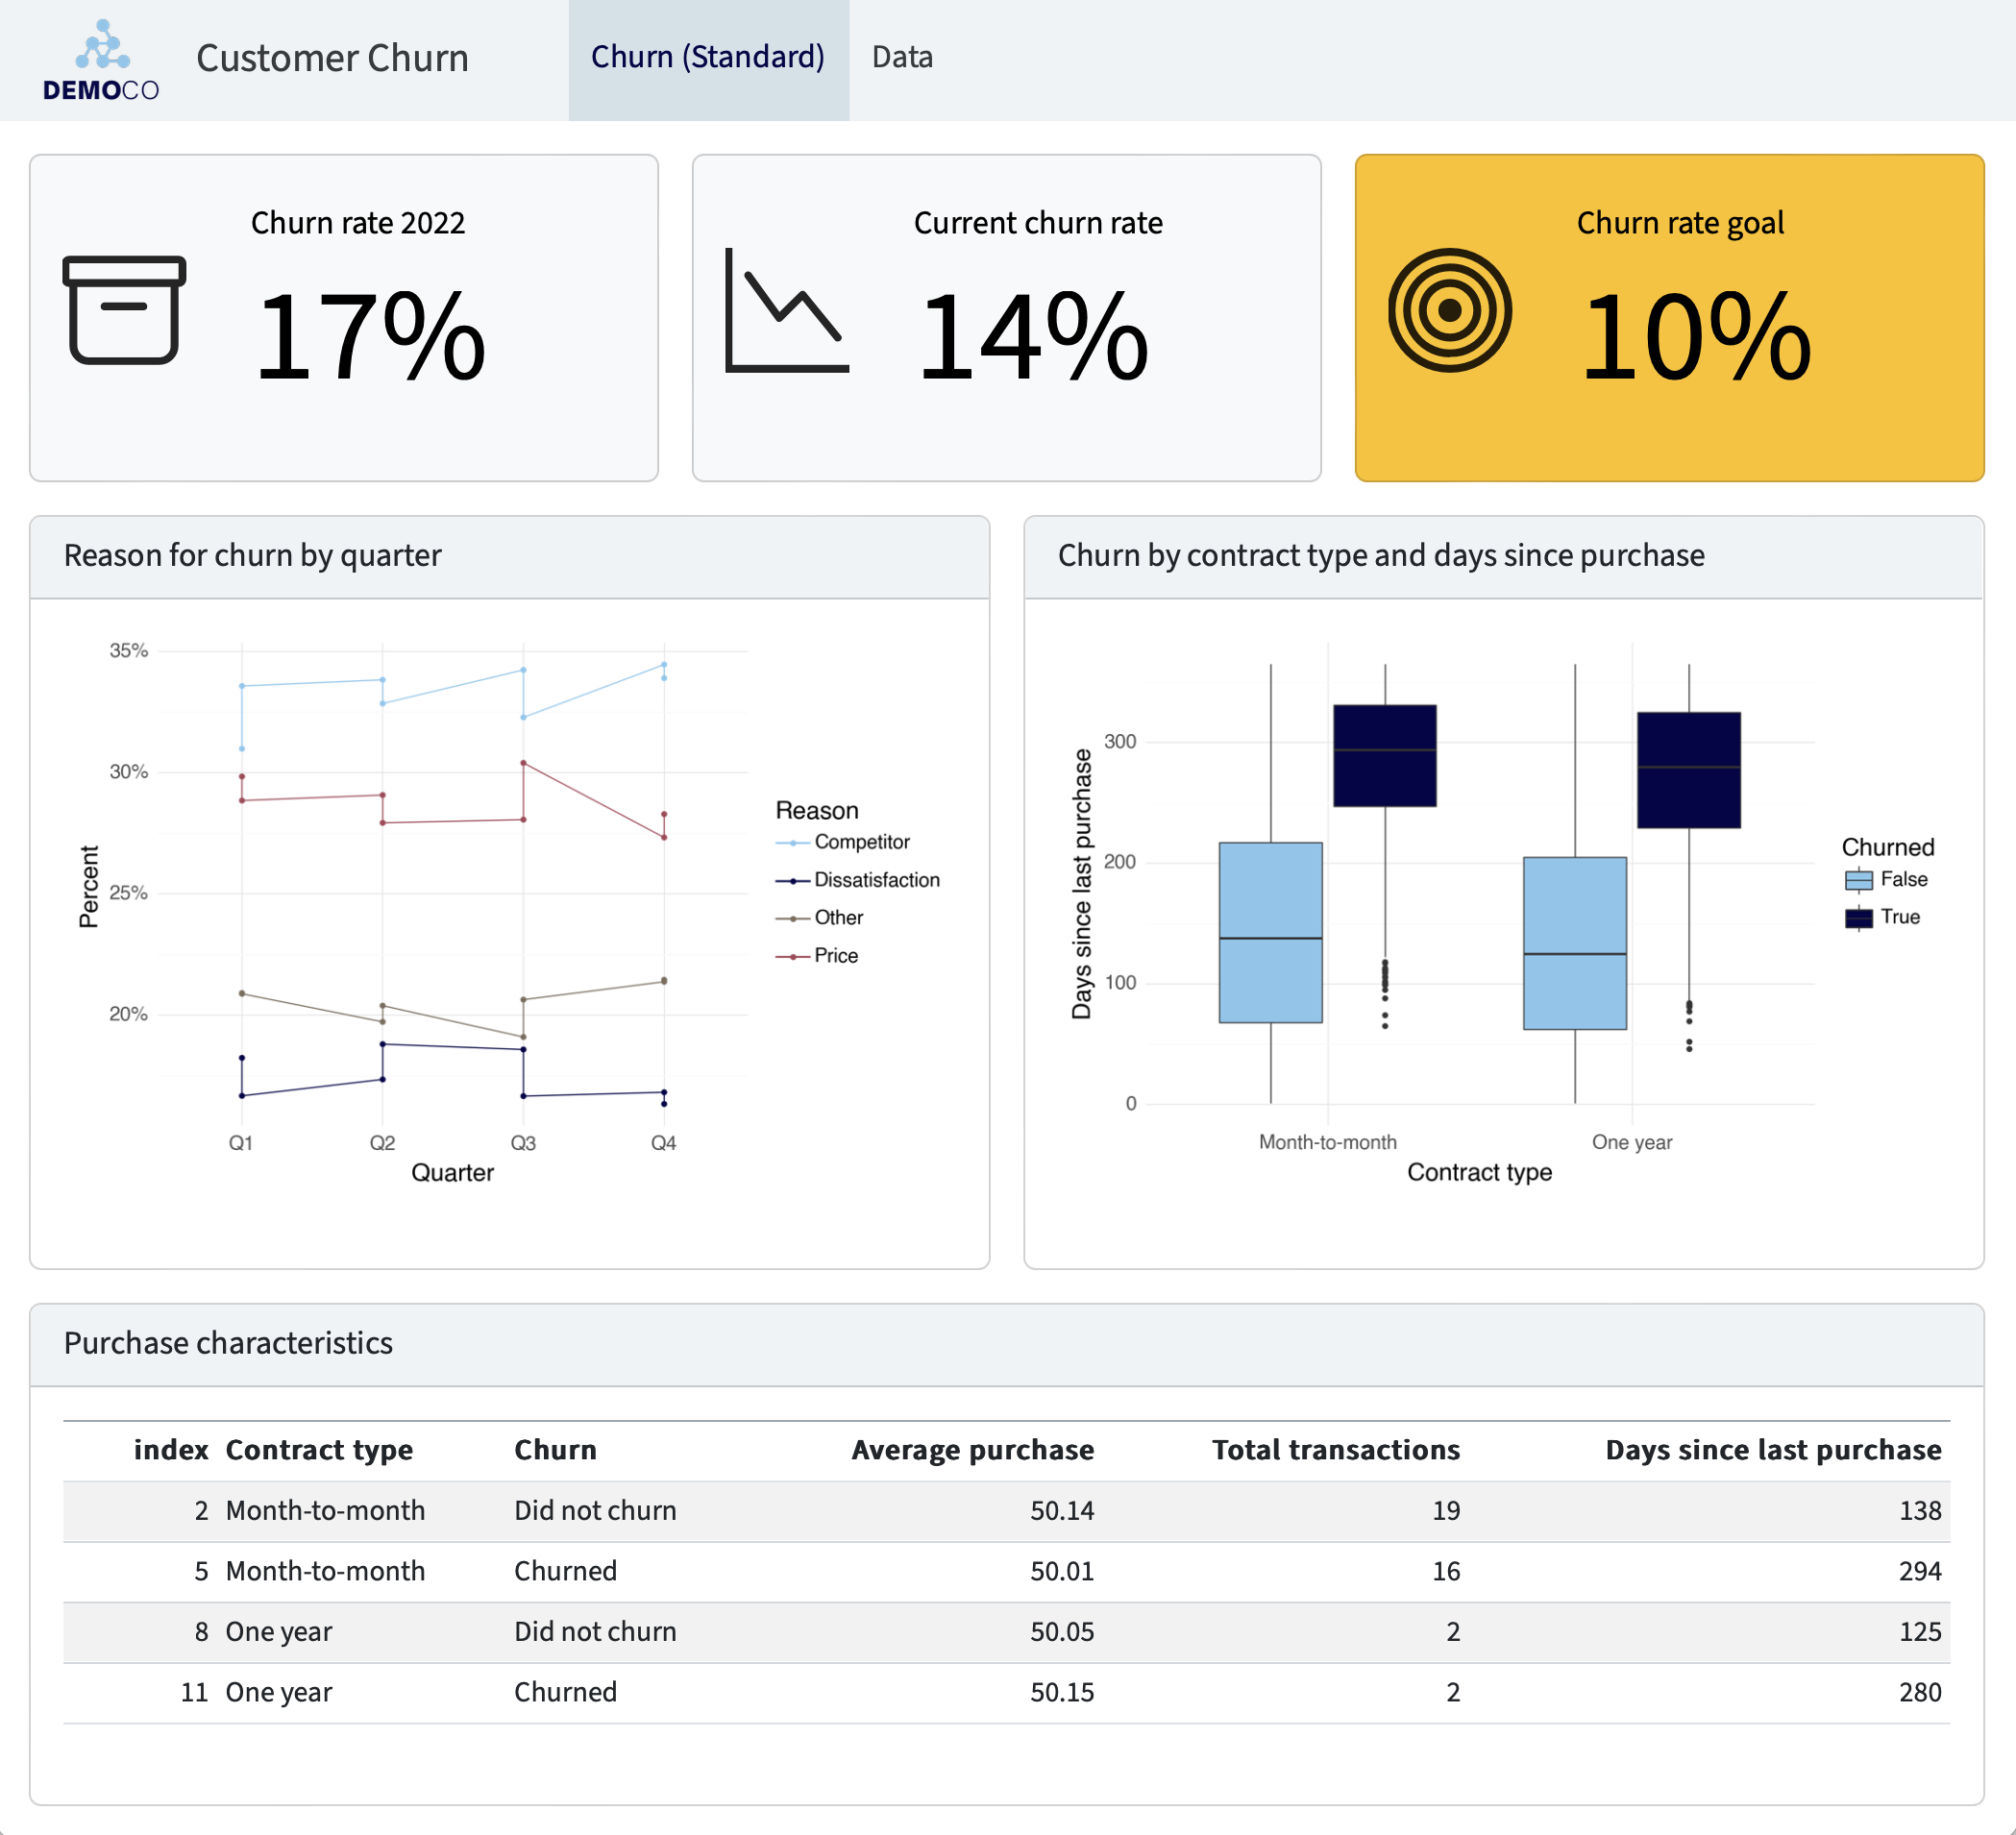
Stop Building Dashboards
python
sql

Gasoline Prices in Mexico
python


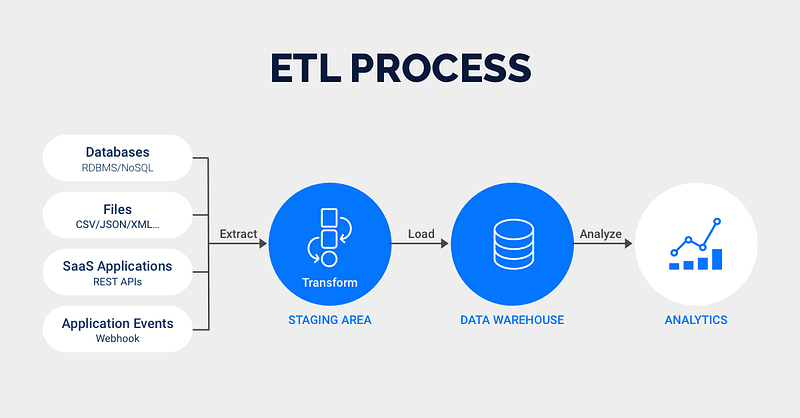
Data Alchemy, SQL Analysis within Python
python
sql


%20(1000%20%C3%97%20642px).png)


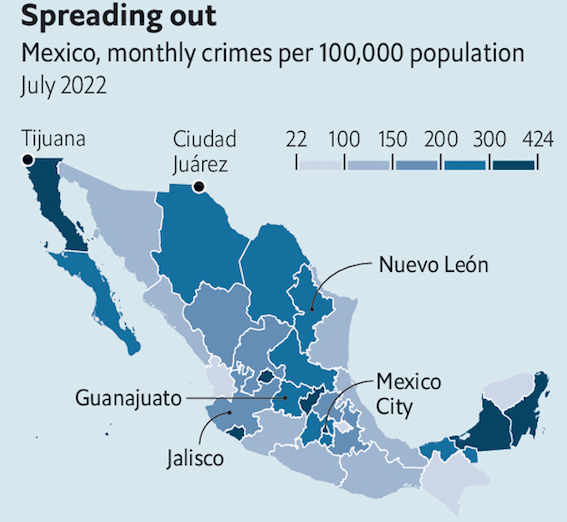
Mexico’s Peace index 2024
python


Federal Prisons in Mexico
python
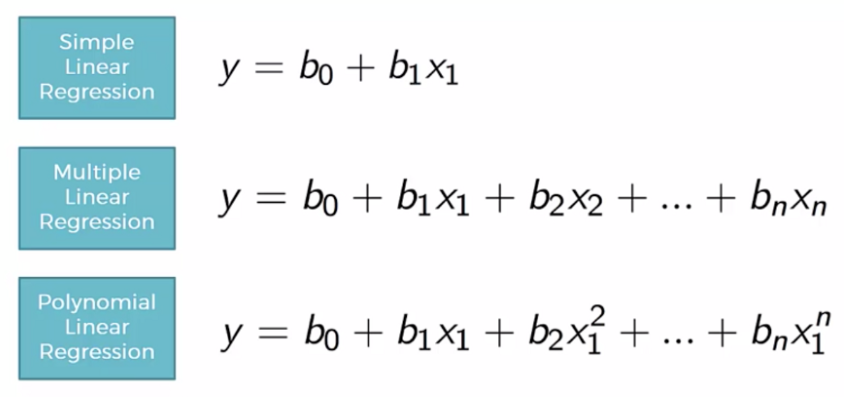
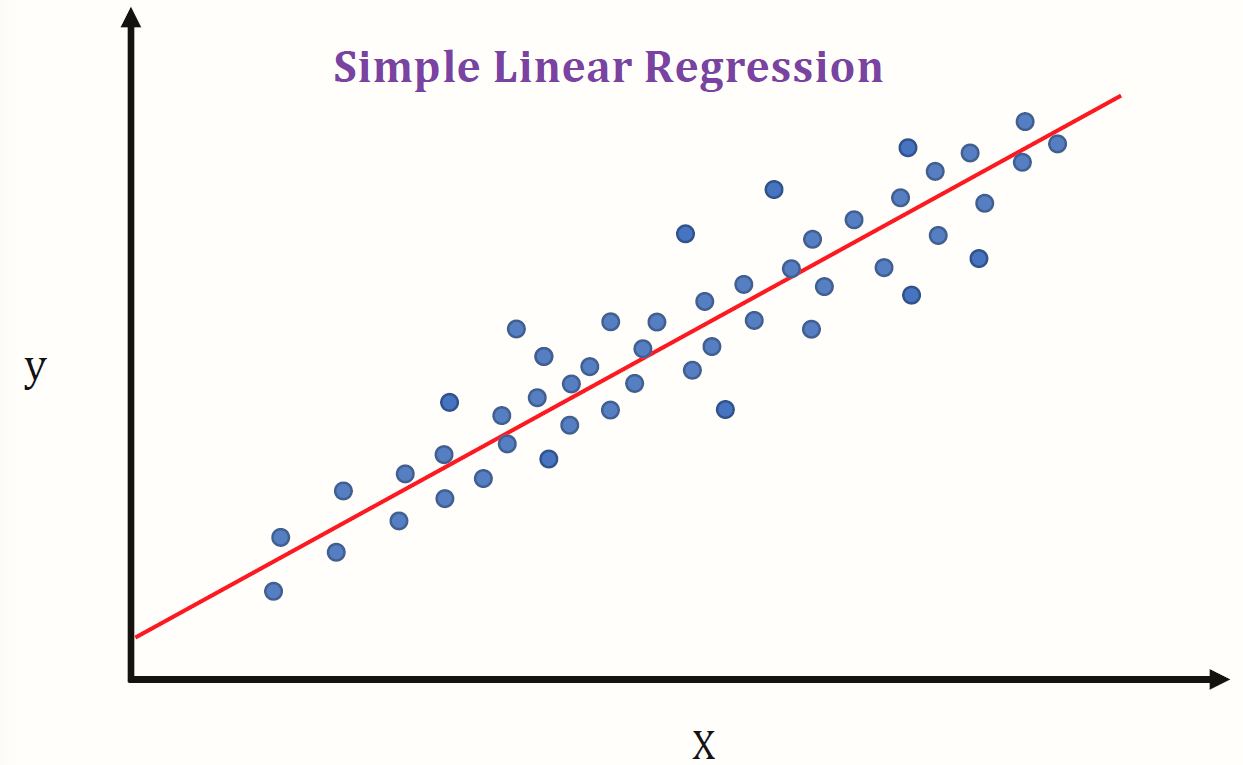
Regression Analysis Overview
python
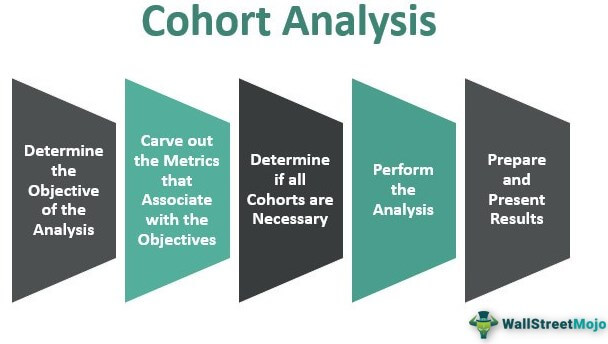
Cohort Analysis
python


No matching items