Summary
We used Looker Studio to present results about customer behavior and online sales and conversions from Google Analytics.
Google Analytics is a powerful tool for any business, but it becomes especially crucial for e-commerce businesses. It provides a wealth of data and insights into how customers interact with your online store, allowing you to optimize your website and marketing efforts to drive sales.
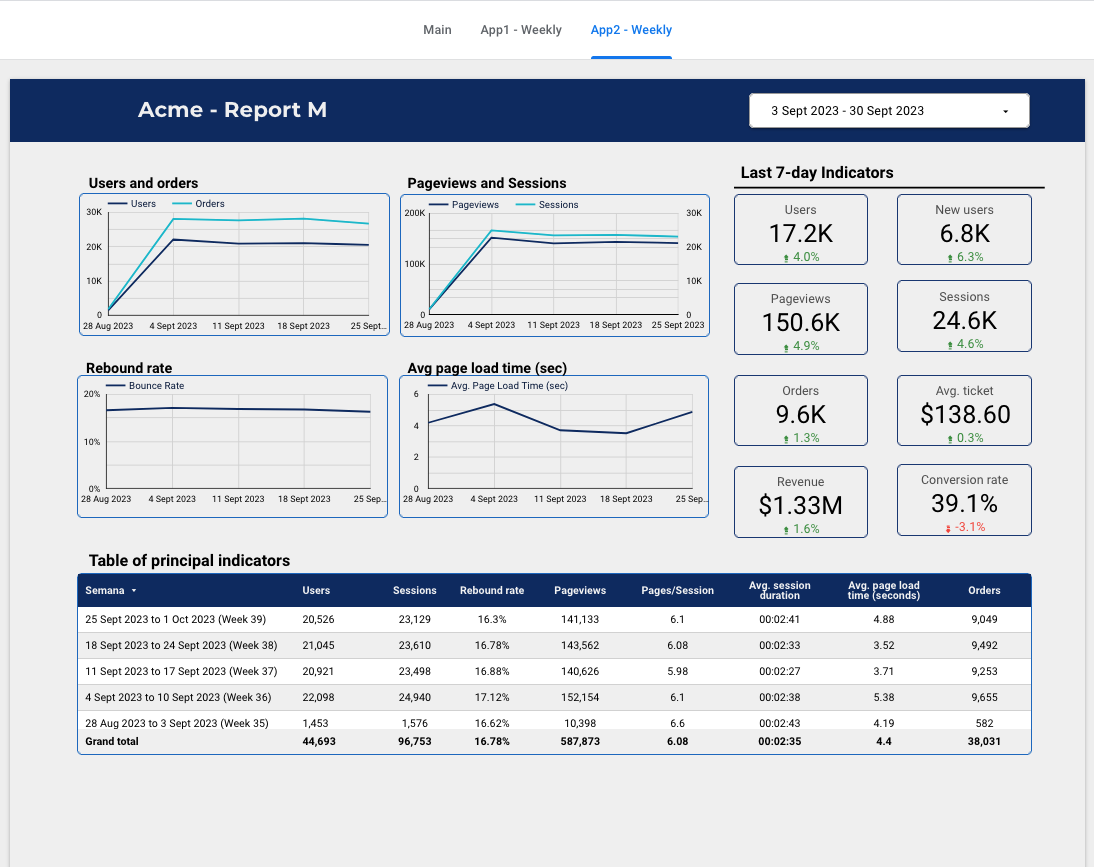
E-Commerce Weekly Dashboard
Project Goal: This dashboard was designed to track the principal indicators about e-commerce from websites and mobile apps.
Data Sources: The data mainly come from Google Analytics tracking websites and mobile apps.
Key Metrics: The dashboard shows users, new users, pageviews, sessions, orders, revenue and conversion rates.
Visualizations: The types of charts used are time series for behavior, KPI cards, bar charts for categories and tables for detailed information.
Target Audience: The dashboard was designed for marketing managers and their teams.
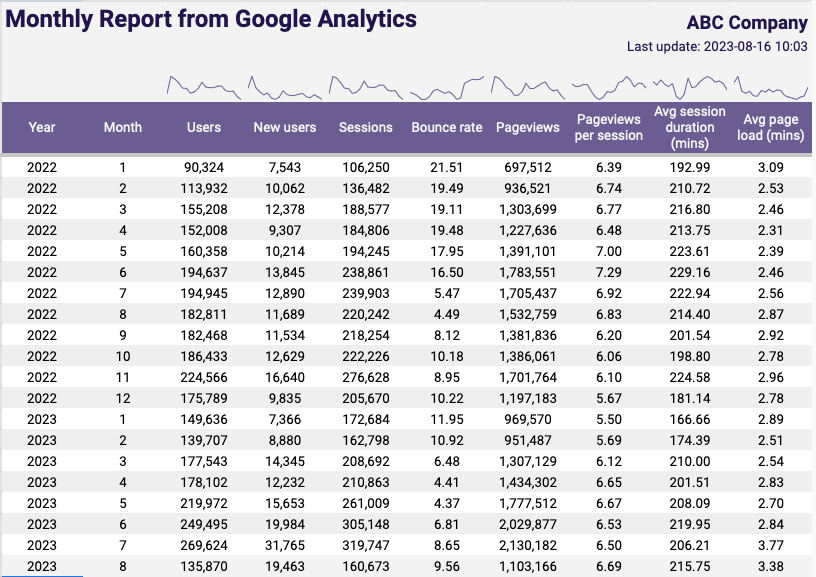
E-Commerce Weekly Report
- Project Goal: This report was designed to track the principal indicators about e-commerce from websites and mobile apps.
- Data Sources: The data mainly come from Google Analytics tracking websites and mobile apps.
- Key Metrics: The report shows users, new users, pageviews, sessions, orders, revenue and conversion rates by year and month.
- Visualizations: The types of charts used are sparklines for behavior of the different metrics.
- Target Audience: The report was designed for the marketing team for operational monitoring.
References
Contact
Jesus LM
Economist & Data Scientist