Water Collection System in Mexico City - 2022
Jesus LM
Economist & Data Scientist
Economist & Data Scientist
Mar 28, 2024
Summary
Rainwater harvesting is a sustainable and effective way to manage water resources in Mexico.
By promoting water conservation and increasing water security, these systems offer a path towards a more water-resilient future.
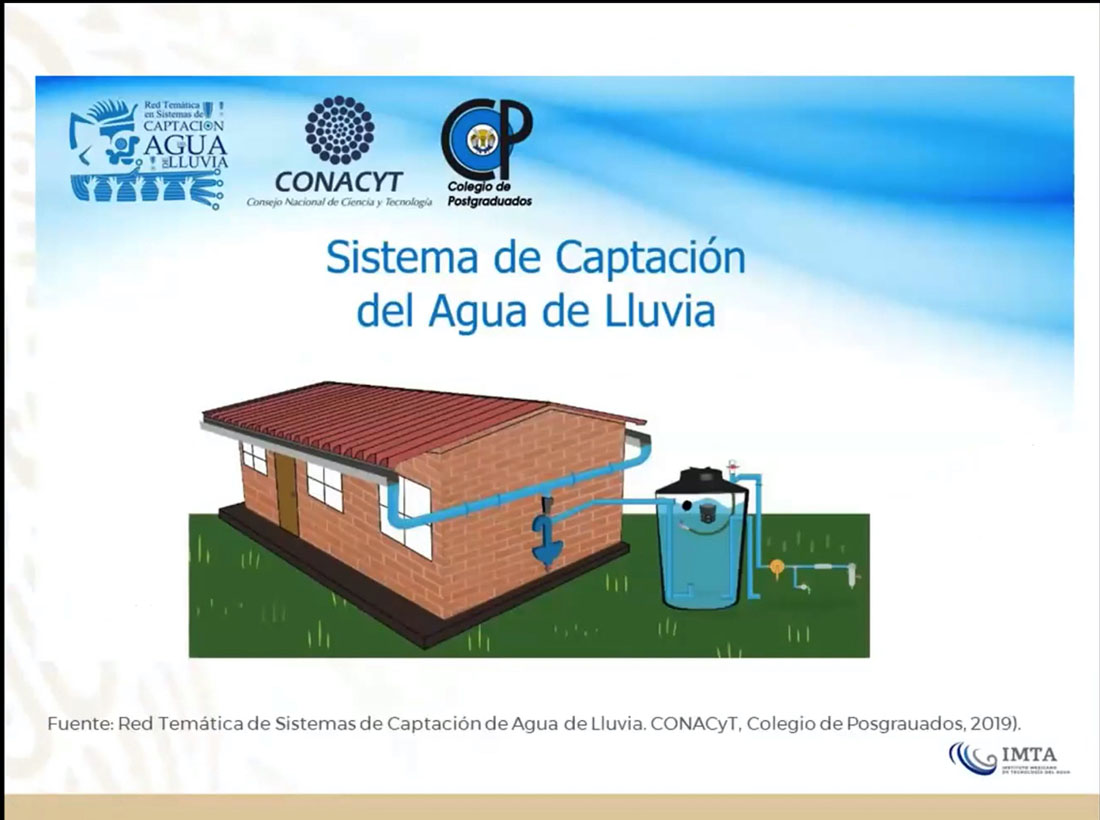
What is SCALL?
Rainwater harvesting systems are a prominent water collection method in Mexico, especially in areas facing water scarcity. These systems, called “Sistemas de Captación de Agua de Lluvia” (SCALL) offer several benefits:
- Reduced strain on aquifers: By collecting rainwater, these systems decrease reliance on groundwater sources, which are often overexploited.
- Improved water security: Especially in peri-urban areas, rainwater harvesting provides a more dependable water source, particularly during dry spells.
- Cost-effective solution: Rainwater harvesting can significantly reduce water bills for households.
- Empowering communities: Programs like “Agua a tu Casa” in Mexico City train women to install and maintain these systems, fostering economic opportunities.
Environment setting
Import libraries
Load dataset
Dataset preview
Dataset extract
df.columns = ['file', 'village', 'scall', 'territory', 'facility_date', 'capacity', 'alcaldia',
              'suburb', 'latitude','longitude']
df.head(3)| file | village | scall | territory | facility_date | capacity | alcaldia | suburb | latitude | longitude | |
|---|---|---|---|---|---|---|---|---|---|---|
| 0 | 1-MEMEMA-MIA-22 | SAN ANTONIO TECOMITL | BARRIO XALTIPAC | NO APLICA | 2022-05-02 | 2500 | MILPA ALTA | SAN ANTONIO TECOMITL (PBLO) | 19.219028 | -98.991283 |
| 1 | 2-RUCOAL-MIA-22 | SAN ANTONIO TECOMITL | BARRIO TENANTITLA | NO APLICA | 2022-05-07 | 2500 | MILPA ALTA | SAN ANTONIO TECOMITL (PBLO) | 19.219880 | -99.002227 |
| 2 | 3-GAALRA-MIA-22 | SAN ANTONIO TECOMITL | BARRIO XALTIPAC | NO APLICA | 2022-07-21 | 2500 | MILPA ALTA | SAN ANTONIO TECOMITL (PBLO) | 19.218343 | -98.997507 |
Descriptive Statitistics
Summary of basic stats
| capacity | latitude | longitude | |
|---|---|---|---|
| count | 16971.000000 | 16971.000000 | 16971.000000 |
| mean | 2200.218019 | 19.244556 | -99.057861 |
| std | 574.321315 | 0.169027 | 0.069845 |
| min | 1100.000000 | 0.000000 | -99.245452 |
| 25% | 2500.000000 | 19.192449 | -99.089082 |
| 50% | 2500.000000 | 19.218752 | -99.029098 |
| 75% | 2500.000000 | 19.274890 | -99.003864 |
| max | 2500.000000 | 19.578064 | -98.961553 |
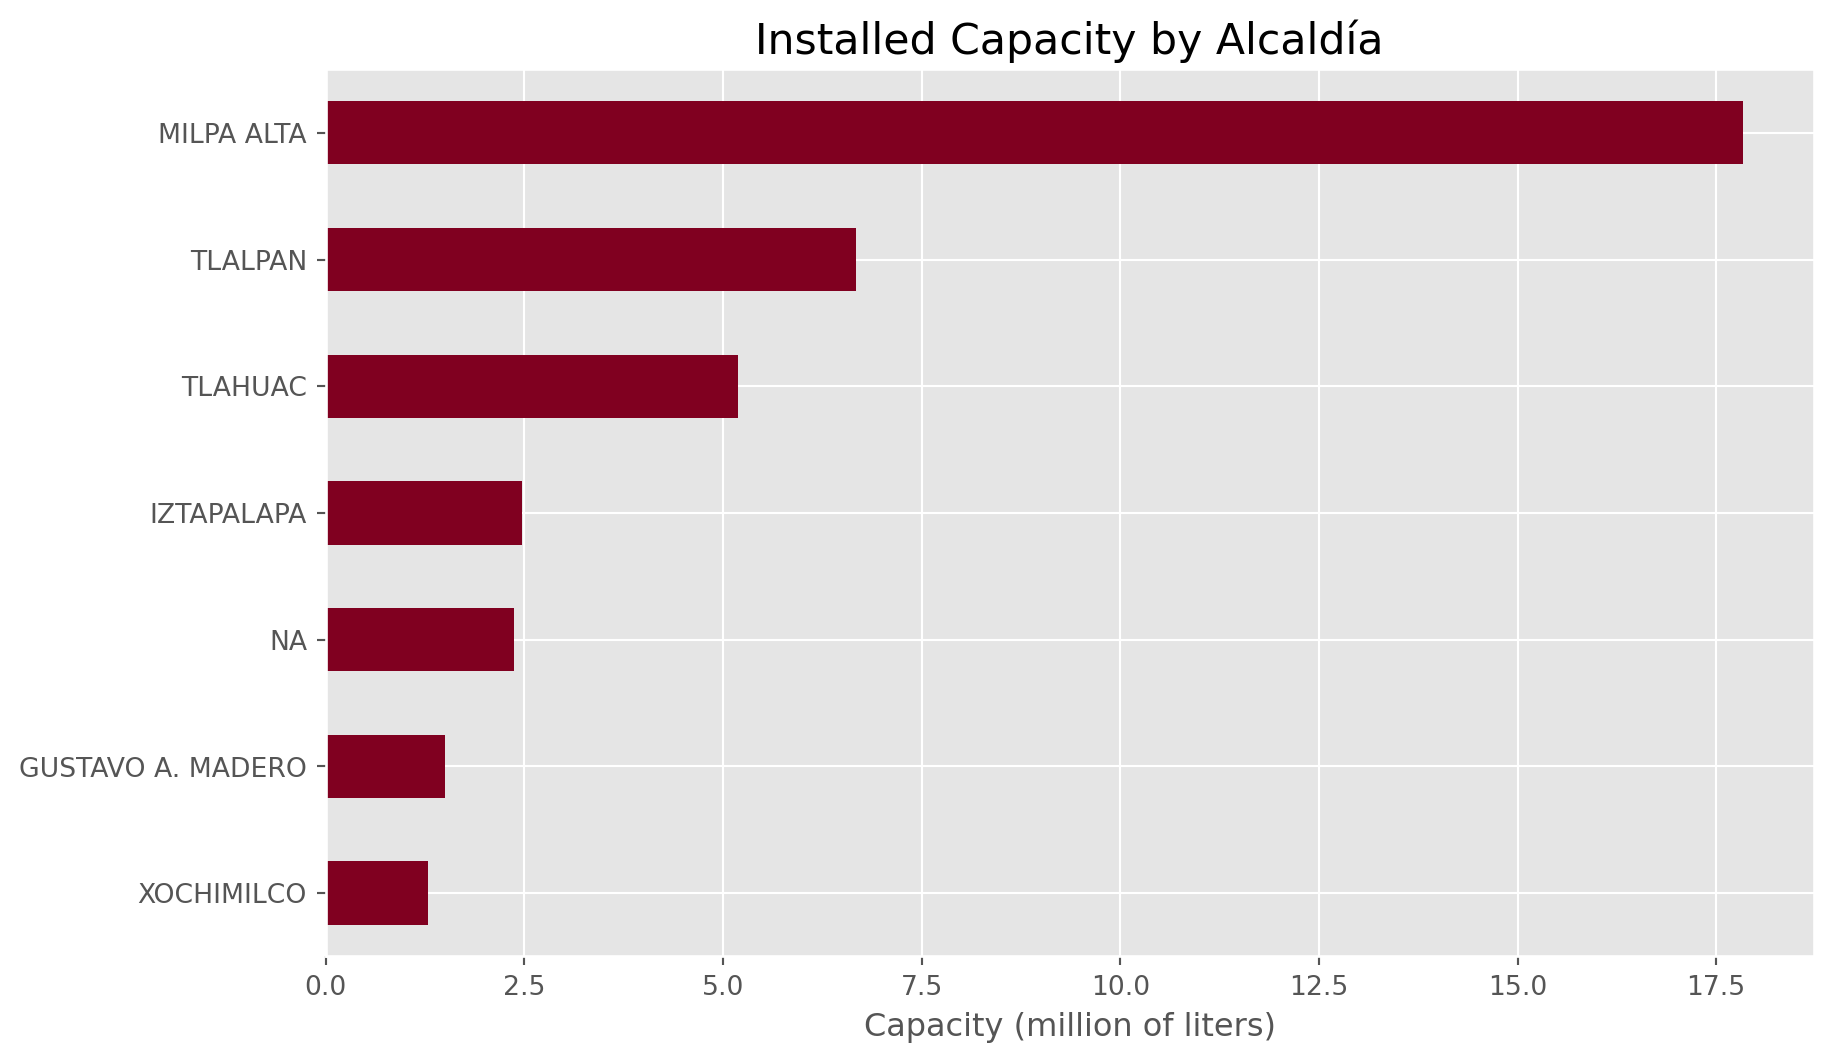
Installed Capacity by Alcaldia
We will group capacity by alcaldia
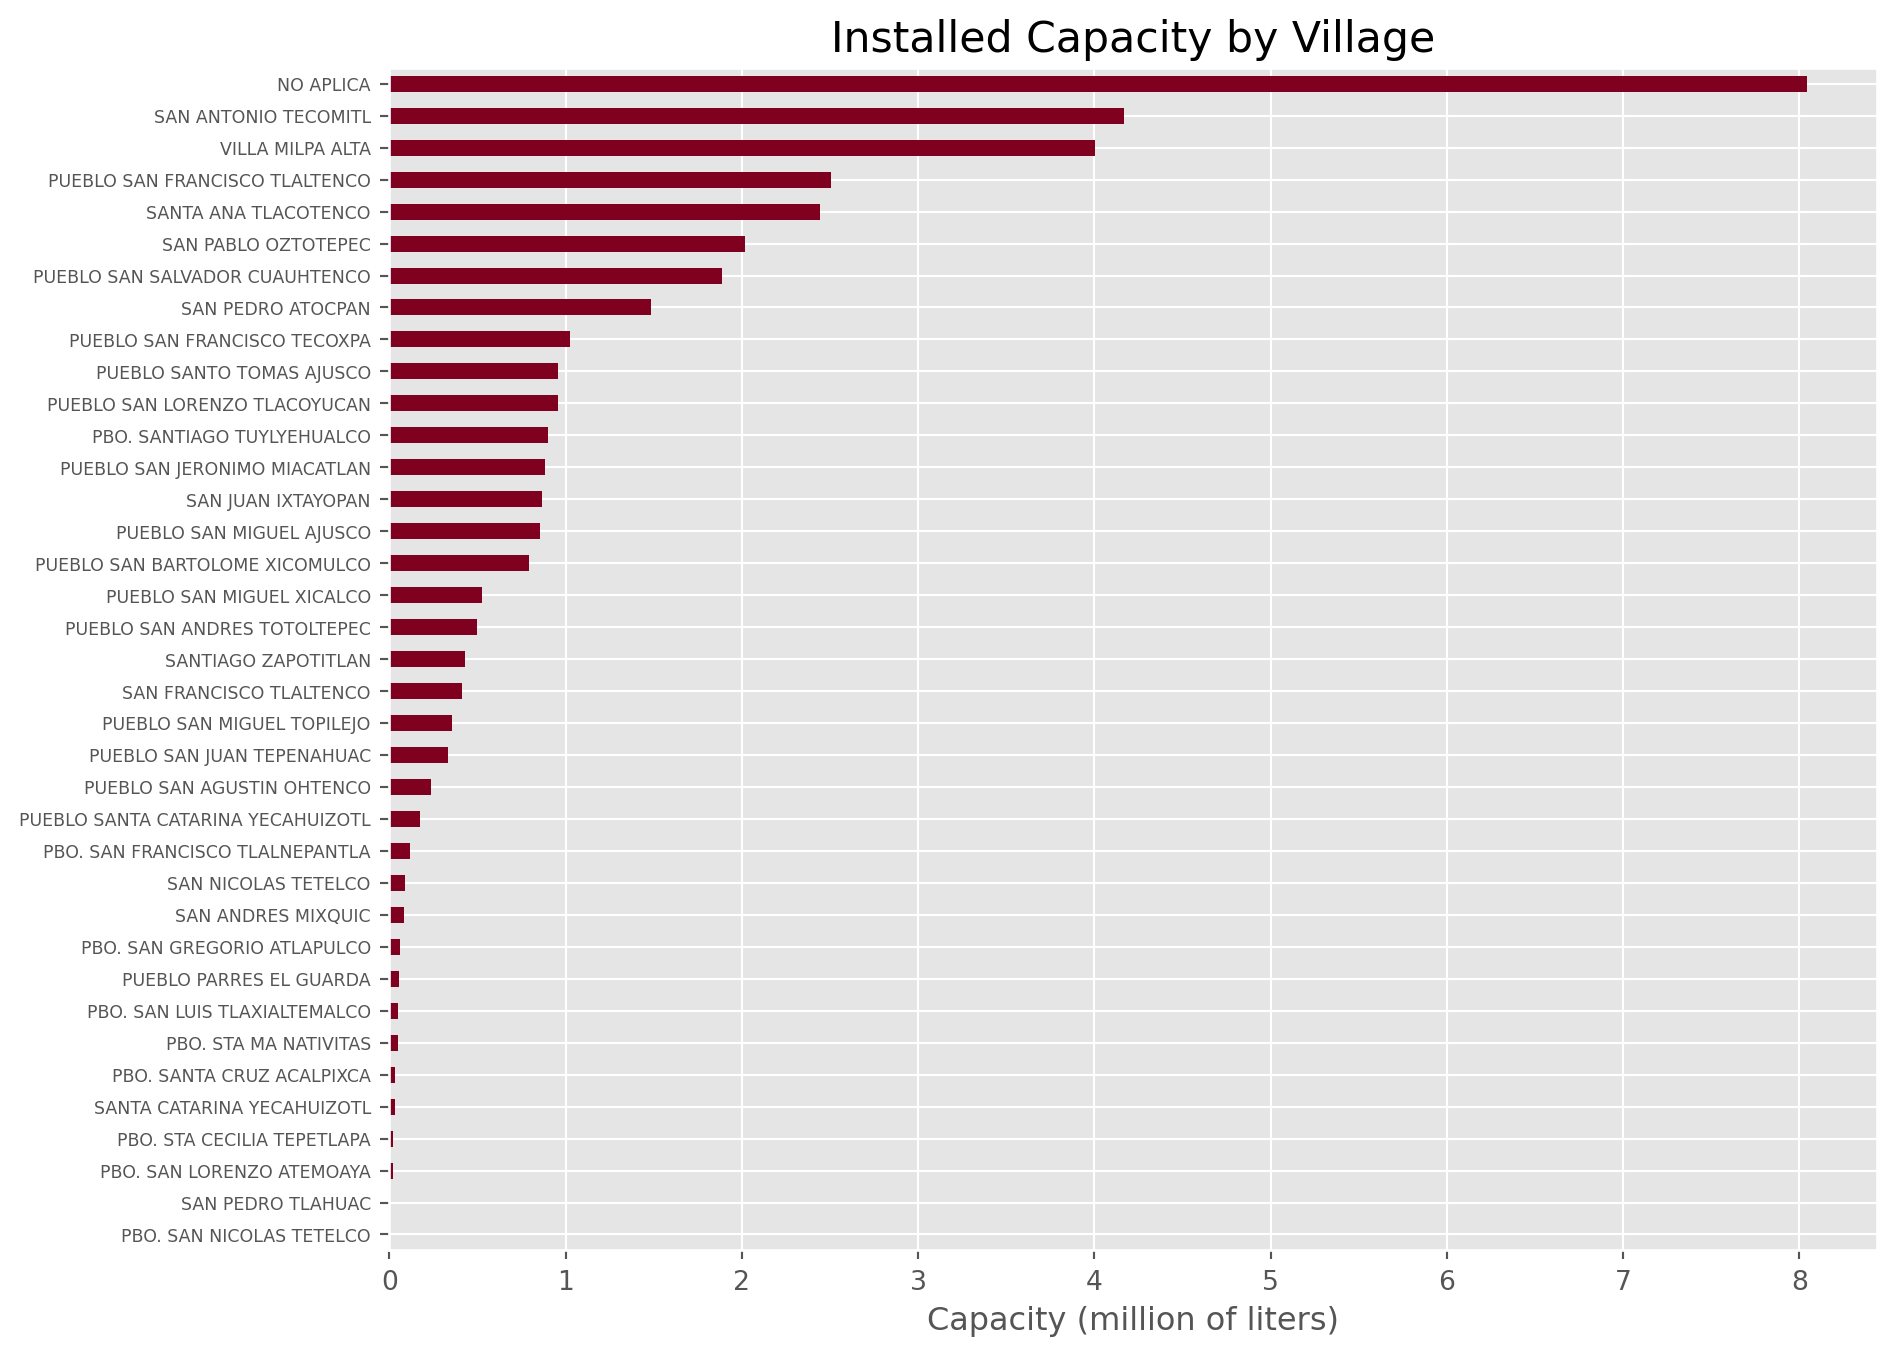
Installed Capacity by Village
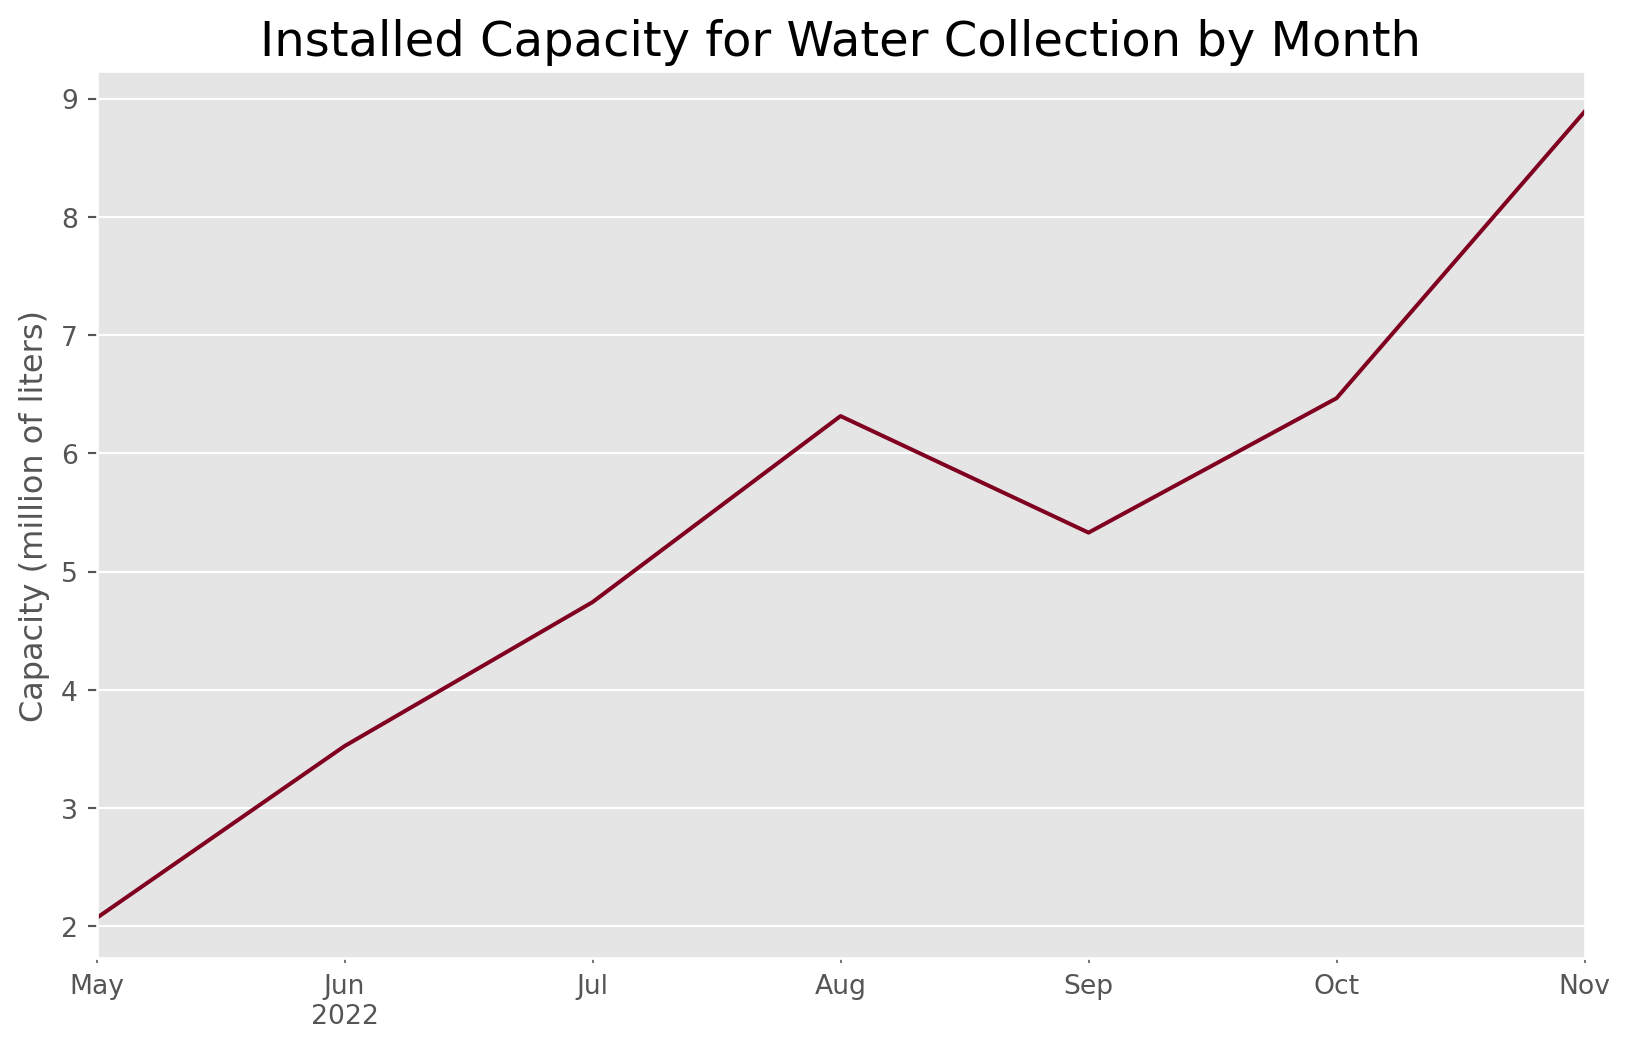
Installed Capacity by Month
Villages with Installations
<folium.plugins.fullscreen.Fullscreen at 0x7ccc88141670>References
Resources
Contact
Jesus LM
Economist & Data Scientist
© 2024 All rights reserved