Summary
In this section we present some examples of charts created with Tableau.
Keep in mind that dashboards are instrinsically “exploratory”, i.e. you need to actively explore and interact by yourself with dashboards. There is no guided path.
Dynamics of Personnel Deployed in Mexico
NoteNote
Click below to wath the video
Example of cloud chart
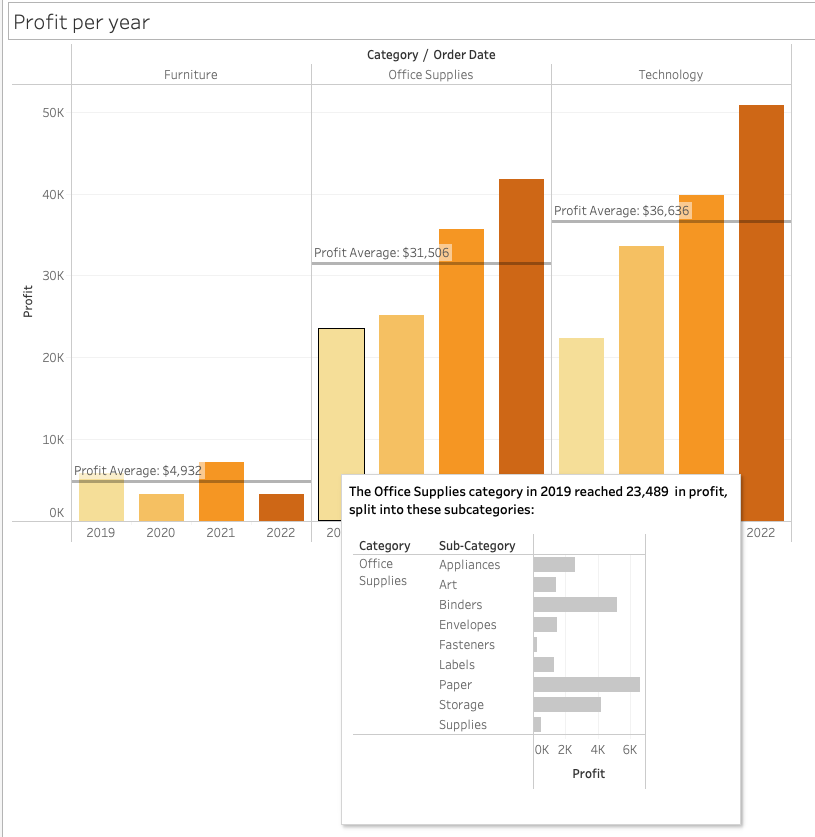
Profits by year and category
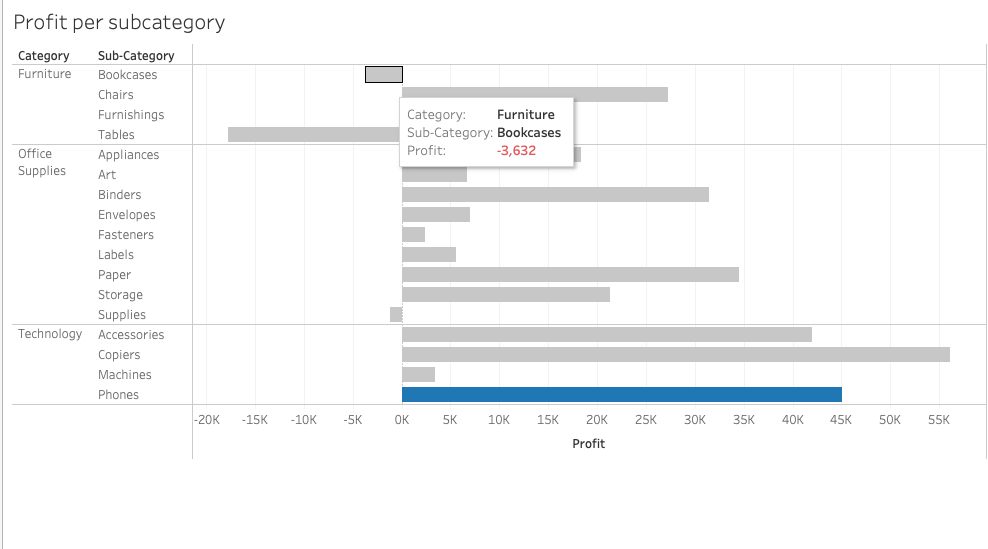
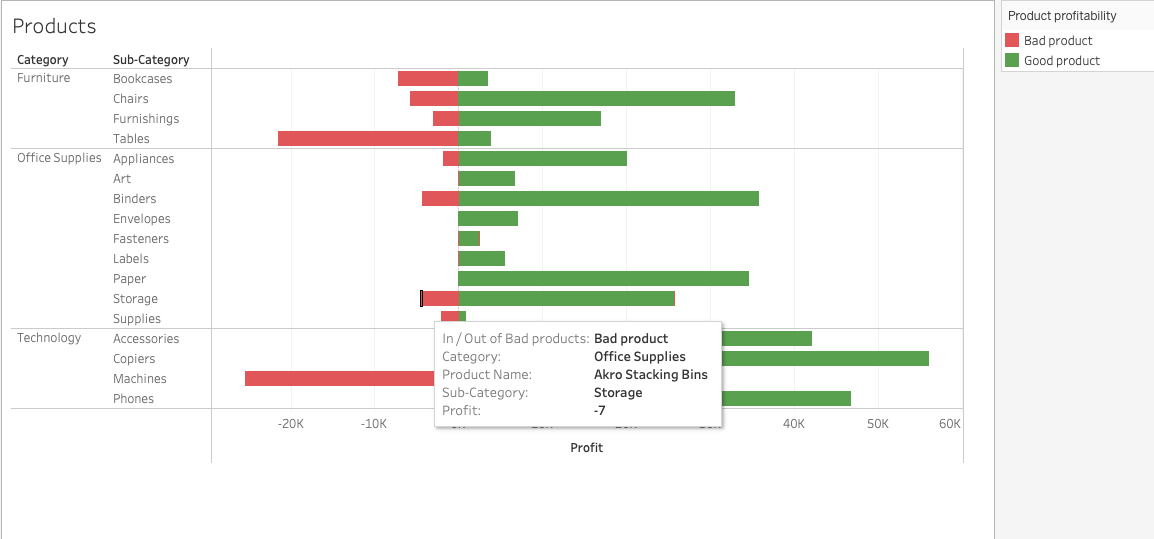
Profit/Loss by sub-category
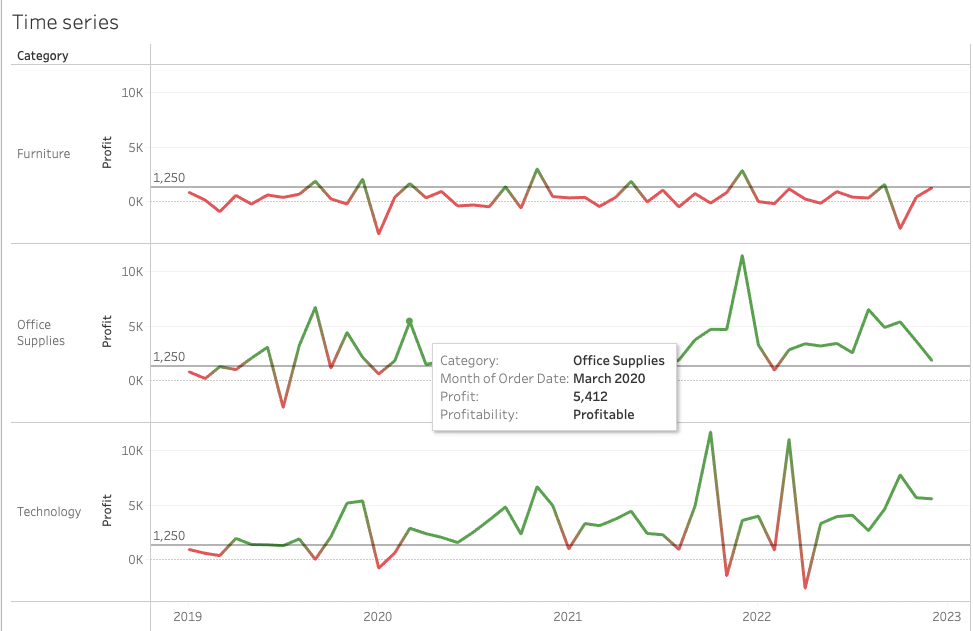
Profit/Loss in function of minimum expected level by category
Identification of products by profit or loss contribution
Contact
Jesus LM
Economist & Data Scientist