Show code
from plotnine import *
from plotnine.data import *
import numpy as np
import pandas as pd
import polars as pl
from datetime import datetime
import warnings
warnings.filterwarnings('ignore')An Overview of the famous ggplot2 R package in Python
Plotnine library in Python is based on the famous ggplot2 R package. In this article, we will show some examples of this superb visualization library.
![]()
ggplot2 is based on Hadley Wickham’s Layered Grammar of Graphics1, which provides a systematic way to describe the components of a statistical graphic.
ggplot2 is a declarative language, which implies to specify the “what you want” to plot, rather than “the how”.
ggplot2 has a wide range of features, including:
There are 03 compulsory components for building visualizations with plotnine:
from plotnine import *
from plotnine.data import *
import numpy as np
import pandas as pd
import polars as pl
from datetime import datetime
import warnings
warnings.filterwarnings('ignore')economics = pl.from_pandas(economics)(
ggplot(data=economics)
+ aes(x='date', y='uempmed')
+ geom_line(color='#670000', size=1)
+ labs(title='US unemployed duration (weeks)')
+ theme(figure_size=(16, 8),
axis_text_x = element_text(color="black", size=18, angle=0, hjust=.3),
axis_text_y = element_text(color="grey", size=16),
plot_title = element_text(size = 25, face = "bold"),
axis_title = element_text(size = 18)
)
+ xlab('')
+ ylab('Unemployed duration (median)')
).draw()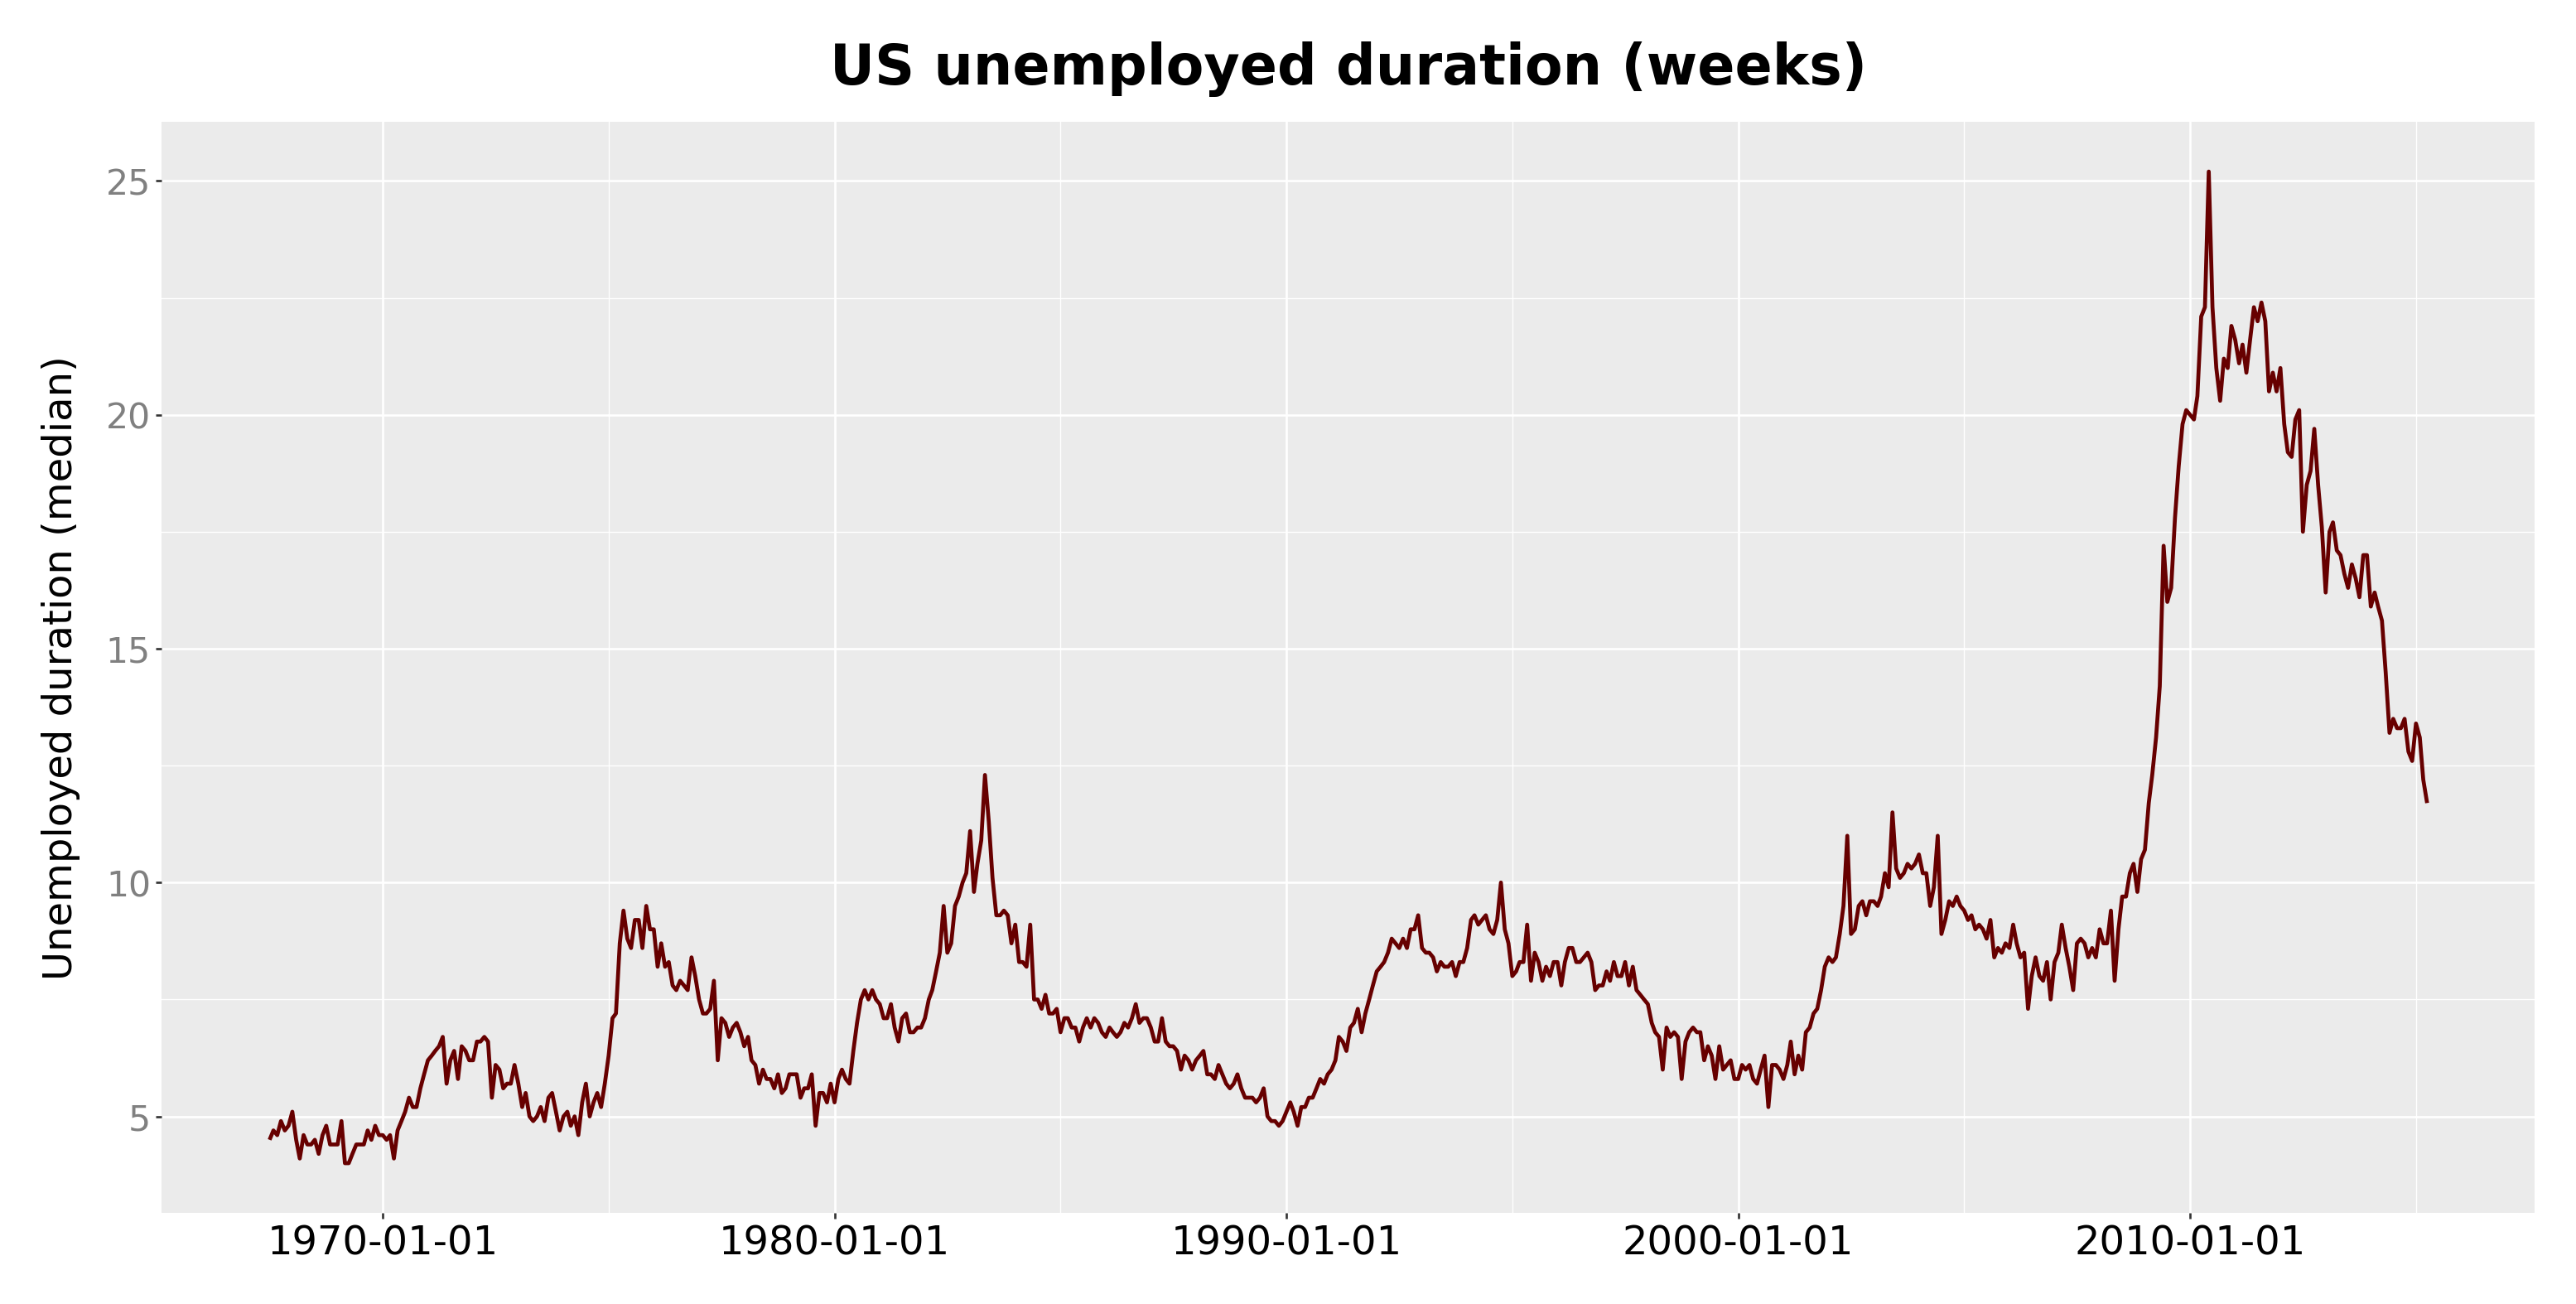
Jesus LM
Economist & Data Scientist
Hadley Wickham (2010) A layer Grammar of Graphics.↩︎