Jesus LM
Economist & Data Scientist
About me
I’m a professional with +10 years of experience applying data analysis in sectors like public security, e-commerce, and healthcare. Passionate about creating tools that make data accessible and impactful. I primarily use SQL, Python and Tableau.
Background in Economics (BA), Information Technology (MA) and Data Science and Machine Learning (Certification).
Committed to fostering data literacy, I share some data posts on Learning Data and T3CH via Medium.
Data as Code Philosophy
With a background of economics and data science, I advocate for a Data as Code approach. While traditional BI tools (like Tableau or Power BI) are useful for quick visualizations, they often create information silos that are difficult to version-control, audit, or automate.
My workflow is built on 03 core pillars:
Reproducibility: Whether it’s a executive report or an economic forecast model, the path from raw data to final insight must be scripted and version-controlled via Git. If a result isn’t reproducible, it isn’t reliable.
Modern Data Stack: I leverage high-performance tools like DuckDB and Polars to process large datasets locally and efficiently. This reduces infrastructure costs and allows for “BI-as-Code” using frameworks like Streamlit or Shiny.
Narrative-Driven Analytics: Data is only as good as the story it tells. I elaborate statistical analysis with clear, executive-level prose documents and slideshows, ensuring that technical findings lead to actionable decisions.
IT Tools
Databases
- Duckdb
- Snowflake
- BigQuery
- Postgresql
- MySQL
- Oracle
- SQLServer
Python libraries
- polars
- pandas
- plotly
- scikit-learn
- folium
- streamlit
- shiny
Other
- Tableau
- Power BI
- Evidence.app
- MS-Office (Word, Excel, Powerpoint, Access)
- Google Apps (Sheets, Docs, Slides, Forms, Gemini, etc)
- Jira, Trello
- Git, Github, Bash
Mexico City Crime Visualization
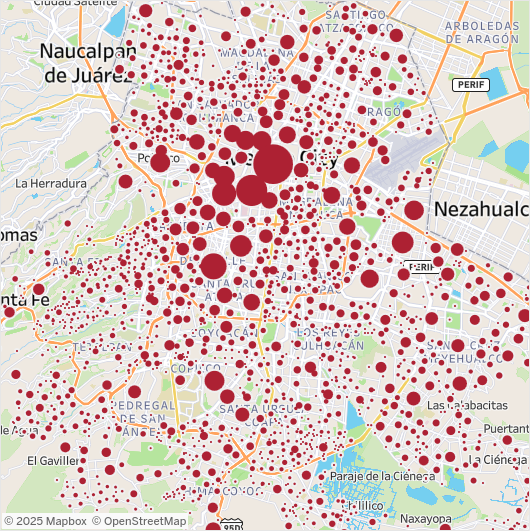
Available at: https://j3susl-monroy.evidence.app
![]()
![]()
![]()